Validate Your Cold Chain in Motion. Professional GDP Compliance.
The Road Is the Most Vulnerable Link in the Cold Chain
Warehouse storage is relatively stable and controlled. Transport is not. During transit, temperature-sensitive product faces greater exposure to ambient swings, solar heat gain, infiltration, airflow variability, and refrigeration system stress.
Because of this, the in-transit segment often represents the greatest risk to an unbroken cold chain. Trailer Thermal Mapping Qualification demonstrates your vehicles can protect temperature-sensitive product under real operating conditions and maintain acceptable conditions where it matters most: on the road.
The Science of Trailer Validation
✓ 3D Uniformity Profiling
We don’t just check the air near the cooling unit. Our mapping studies utilize high-resolution sensor grids in compliance with WHO Annex 9 to identify:
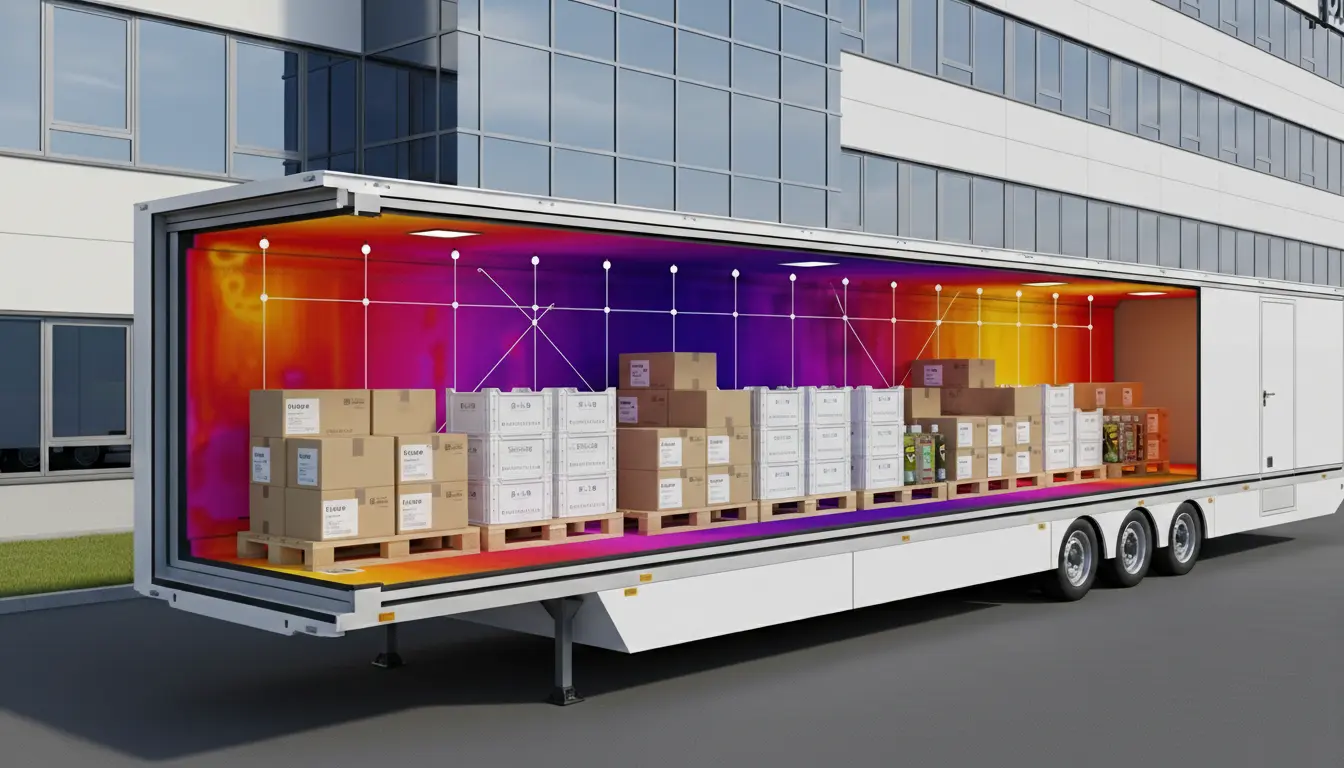
- The “Hot Zone”: Typically near the rear doors where insulation is weakest.
- The “Short-Cycle” Zone: Areas where improper loading obstructs airflow, preventing the rear of the trailer from cooling.
✓ Open Door & Power Failure Stress Testing
Real-world cold chain risk is often introduced during loading, unloading, delays, and loss of refrigeration. Our protocols can include stress testing to evaluate how the trailer performs under these vulnerable conditions:
- Open Door Studies: To measure temperature excursion risk during controlled door-open events and evaluate thermal recovery after doors are closed.
- Power Failure / Reefer Interruption Studies: To assess how quickly conditions drift during refrigeration loss and how effectively the trailer recovers once power or cooling is restored.
These studies help define acceptable operating limits, response times, and risk controls for protecting temperature-sensitive product in transit.
✓ Loaded vs. Empty Stress Testing
An empty trailer behaves differently than one packed with pallets. Our protocols include:
- Empty Chamber Mapping: To verify the reefer’s raw performance.
- Loaded Penetration Studies: To document how product mass affects thermal recovery during stops and door openings.
✓ Seasonal & Extreme Weather Profiles
A trailer that passes in the winter may fail under a desert summer sun. We offer Seasonal Validation to ensure your fleet is “All-Weather” compliant, documenting the impact of solar radiation on the trailer shell.
Full-Spectrum Fleet Mapping Solutions
| Validation Type | Focus Area | Compliance Standard |
|---|---|---|
| Reefer Trailer Mapping | 48′ / 53′ Semi-Trailers. | GDP / USP <1079> |
| Last-Mile Van Mapping | Sprinter & Delivery Vans. | Pharmacy Boards / VFC |
| Recovery Challenge | Door-opening impact. | Quality Risk Management |
| Hold-Over Analysis | Power/Fuel failure safety window. | Emergency SOP Planning |
Why Choose Our Mapping Infrastructure?
- NIST-Traceable Accuracy: Every mapping study is executed with metrology-grade loggers, calibrated specifically for the narrow pharmaceutical “sweet spots.”
- Ruggedized Long-Range Hardware: Our mapping sensors transmit through heavy-duty trailer walls, allowing our engineers to monitor the study in real-time while the truck is in motion.
- Audit-Ready Reporting: Receive a comprehensive 21 CFR Part 11 compliant report including heatmaps and pass/fail certification.
- Strategic Sensor Placement: We use mapping data to tell you exactly where your permanent telematics probes should be mounted for maximum risk oversight.
Fleet Mapping FAQ
Q: Does every trailer need its own mapping report?
A: Yes. Under GDP guidelines, you cannot “type-map” one trailer and assume the rest are identical. Each refrigeration unit and trailer body has unique wear patterns and must be individually qualified.
Q: How long does a trailer mapping study take?
A: A standard study typically runs for 24 to 72 hours to capture enough data cycles, including door-opening challenges and defrost cycles.
Q: Can we perform the mapping ourselves?
A: Yes. We offer Remote Fleet Mapping Kits. We ship the pre-calibrated sensors and a visual placement guide; your team secures them in the trailer, and our engineers handle the data analysis and certification.